Secret #30 – Mortgages Are Phenomenally Riskier Today Than When the U.S. Home Ownership Rate Increased the Fastest
Note. This section shows how much safer FHA mortgages were back when they were targeted toward the White middle-class home buyer.
The riskiness of mortgages is traditionally measured this way.
Length of the mortgage. (Shorter mortgages = Fewer foreclosures)
Size of the down payment. (Larger down payments = Fewer foreclosures)
Size of the total monthly mortgage and other debt payments relative to a home owner's total monthly income. (Lower percentage of income going to pay mortgage and other debts = Fewer foreclosures)
Credit history of the home buyer. (Better history of paying off debts = Fewer foreclosures)
Whether the mortgage is to buy a house or replace an existing mortgage. (Refis = More foreclosures)
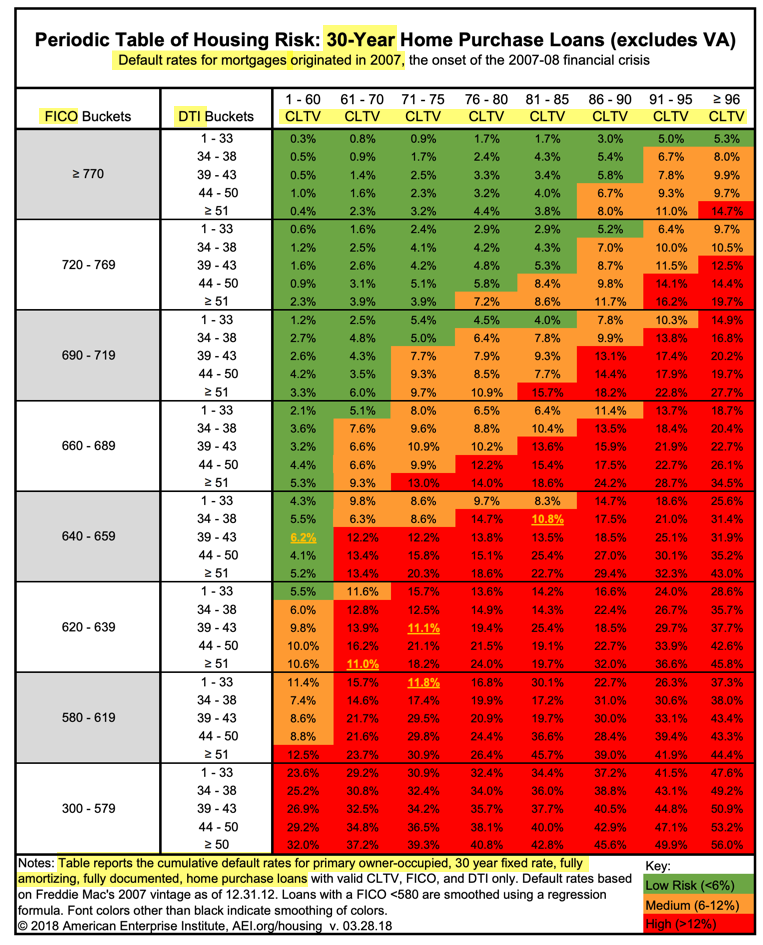
All those risk factors interact with each other in complicated ways but the Housing Center at AEI (American Enterprise Institute) has a great chart that looks at all the interactions for mortgages taken out in 2007 – right before the real estate bust and the Great Recession – and details how different groups of mortgage attributes had much different mortgage default rates during the housing crash. See quick presentations from 2013 about the Mortgage Risk Index here and here.
Source: Pinto, 2018. Highlights by John Wake, RealEstateDecoded.com.
Chart = Default Rates on 30-Year Home Purchase Mortgages Made in 2007.
CLTV = Combined Loan-to-Value Ratio. It’s another way of saying “down payment.” A down payment of 10% is the same as a combined loan-to-value ratio of 90%. “Combined” means if you’re applying for a second mortgage or a HELOC on the same house, they look at all debt backed by the house.
DTI = Debt-to-Income Ratio. It’s total monthly debt payments (mortgage payment including taxes and insurance, and any car loan, credit card, student loan, etc. payments) divided by gross monthly income.
FICO Score = Credit History. FICO scores are the most popular estimates in the U.S. of a borrower’s odds of repaying a loan.
The latest versions of these charts include both 2006 and 2007 mortgages together, and other updates.
More about the Stressed Default Rate of different groups of mortgage attributes here.
Mortgage Risk – 2007 Compared to 1940-1945
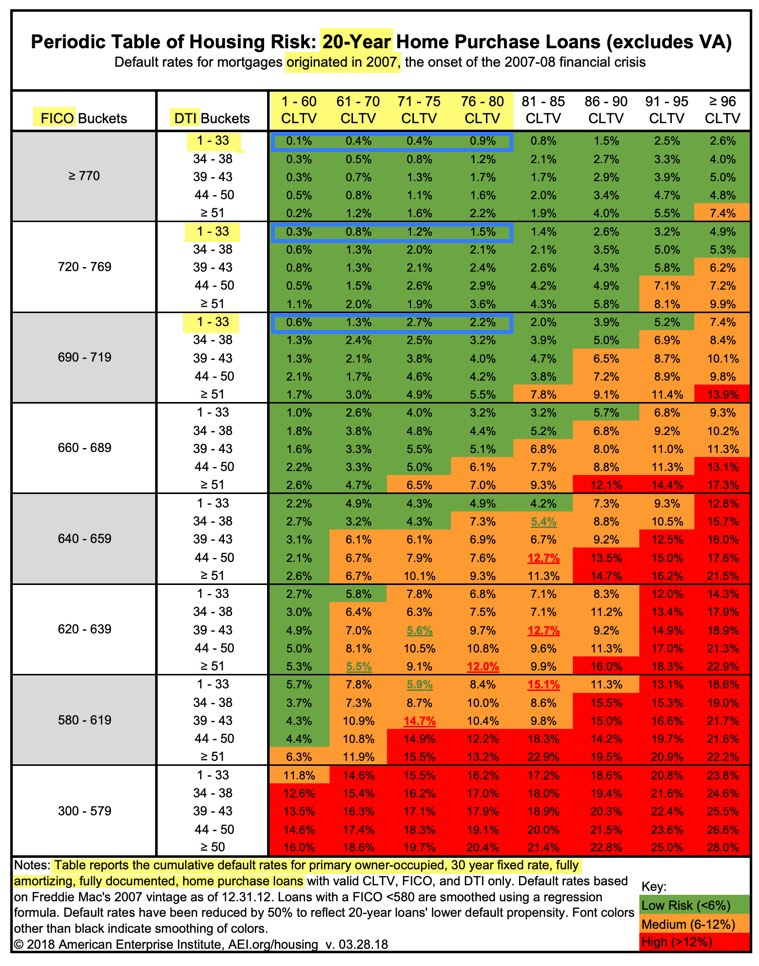
The typical mortgage in 1940-1945 was a maximum of 20 years long, with a minimum down payment of 20%, the buyers didn’t have a lot of debt and their credit histories were good to excellent.
The characteristics of the typical mortgage originated from 1940 to 1945, I outlined in blue in the graph below.
Notice the chart below shows the risk matrix for mortgage default rates on 20-year mortgages which were the longest mortgages available back then on existing homes, whereas the chart above shows the risk matrix for today's 30-year mortgages.
Source: Pinto, 2018. Highlights by John Wake, RealEstateDecoded.com.
Did those super safe mortgages from 1940 to 1945 slow down home ownership gains? No, the U.S. home ownership rate skyrocketed. The huge gains were NOT based on higher-risk, higher-foreclosure, “affordable” mortgages.
The typical mortgage back when U.S. home ownership skyrocketed was conservative, safe, and sustainable even in a theoretical mega-recession as bad as the Great Recession.
That's a big reason why the home ownership gains made back then were NOT lost in future recessions. Those mortgages had very low foreclosure rates even in terrible economic times. That's very different than the last 50 years when all gains in home ownership were later lost.
Back then, we didn’t trade off more house sales today for more foreclosures in the future. Maybe mortgages back then were so safe because FHA mortgages back then were intended for middle-class Whites and maybe as time went on FHA became more and more willing to guarantee riskier and riskier mortgages because they were targeting lower-income families, including Black and minority families.
Note: I use “households” and “families” interchangeably throughout.


